4

I am working on a simulation to explore the usefulness of a patch for the CoinSelection behaviour of BitcoinCore. To that end, I am looking for statistics on the distribution of unspent outputs respective to their value in satoshi.

So far, I haven't found much on the topic beside an outdated number of unspent transaction outputs, as likely search terms collide with a lot of unrelated topics.

Are there any papers or other sources that discuss:

  • How can one realistically model the distribution of the value (in satoshi) of all UTXO (unspent transaction outputs)?
  • What type of curve best approximates the distribution?
  • What are mean, standard deviation, and variance of the network's UTXOs' values?
  • Bonus: How did the distribution of UTXO' values change over time?

Clarification: I am interested in modelling the number of satoshi held in UTXO.

6
  • 1
    All of those questions would be answerable from the block chain. I would plot it as a histogram with x being the value of the UTXOs and y being the number of them.
    – Tyler
    Commented Oct 3, 2014 at 12:55
  • There's multiple properties related to UTXO that come to my mind (e.g. index number, amount, script, txid, age...) - distribution of what quantity do you mean? Try to be more specific please.
    – knaperek
    Commented Oct 19, 2014 at 12:41
  • @JozefKnaperek: Thanks, I was too much in the topic to realize that you could read it in so many different ways. I hope it is clearer now.
    – Murch
    Commented Oct 19, 2014 at 13:06
  • @Tyler: Yeah, I am aware of that. However, my question was, whether I have to do that work, or if someone else already has.
    – Murch
    Commented Oct 19, 2014 at 13:07
  • 1
    OK, makes sense to me now. But I haven't seen such analysis so far; I've found some nice online charts, but none of them does seem to be exactly what you're looking for. You can contact them though and they might add it (i.e. do the work for you :-)). Otherwise I guess you're on your own.
    – knaperek
    Commented Oct 19, 2014 at 14:09

1 Answer 1

3

I haven't read any papers trying to analyze the amount of unspent outputs. More often, people are interested in the distribution of address' balances. This could be interesting because it reflects how evenly distributed bitcoin is.

I did find this article: http://www.coindesk.com/what-block-chain-analysis-tells-bitcoin/, which seems like it might be of interest to you and is related to the distribution of UTXOs.

If you call gettxoutsetinfo with the Bitcoin Core RPC calls, it tells some basic info about the UTXO set. I just did this and got:

{
    "height" : 338396,
    "bestblock" : "000000000000000009f32437cb28d54ff600ec020778c8ce84ecf93b99d5218c",
    "transactions" : 4525842,
    "txouts" : 16217914,
    "bytes_serialized" : 566046691,
    "hash_serialized" : "1ad2172e4d37ce21291c116580f5b527e4c302b9c2ce4e88a91c0c00f748fb8d",
    "total_amount" : 13709764.78496462
}

So it seems that the average amount of an UTXO is:

13709764.78496462 / 16217914 = 0.84534699


To analyze the amount of outputs (note, this is not only UTXOs), I wrote up this quick script:

<?php

require_once 'jsonRPCClient.php';

$bitcoin = new jsonRPCClient('http://{username}:{password}@127.0.0.1:8332/');

$info = $bitcoin->getinfo();

$height = $info['blocks'];
$numTrials = 1000;
$includeCoinbase = false;


$cutoffs = array();

for ($i = 0; $i < 10; $i++) { $cutoffs[] = $i; }
for ($i = 1; $i < 10; $i++) { $cutoffs[] = 10*$i; }
for ($i = 1; $i < 10; $i++) { $cutoffs[] = 100*$i; }
for ($i = 1; $i < 10; $i++) { $cutoffs[] = 1000*$i; }

function GetRange($value) 
{
    global $cutoffs;
    for ($i = 0; $i < count($cutoffs)-1; $i++)
    {
        if ($cutoffs[$i] <= $value && $value < $cutoffs[$i+1])
            return $cutoffs[$i] . " - " . $cutoffs[$i+1];
    }
    return $cutoffs[count($cutoffs)-1] . " - ...";
}

$sum = 0;
$distribution = array();

for ($i = 0; $i < $numTrials; $i++) 
{

    $blockhash = $bitcoin->getblockhash(rand(1, $height));
    $block = $bitcoin->getblock($blockhash);

    $randTxIndex = rand(0, count($block['tx'])-1);

    if ($randTxIndex == 0 && !$includeCoinbase) {
        $i--;
        continue;
    }

    $randTxHash = $block['tx'][$randTxIndex];

    $randTx = $bitcoin->getrawtransaction($randTxHash, 1);

    $numOutputs = count($randTx['vout']);
    $randOutput = $randTx['vout'][rand(0, $numOutputs-1)];

    $value = $randOutput['value'];

    $sum += $value;
    $distribution[GetRange($value)] += 1;
}

echo (json_encode($distribution, JSON_PRETTY_PRINT) . "\n");
echo "average: " . ($sum / $numTrials) . "\n";

And the results are (after being cleaned up a little):

average: 89.55518291596

START   END     COUNT
0       1       636
1       2       73
2       3       18
3       4       20
4       5       14
5       6       11
6       7       8
7       8       8
8       9       11
9       10      12
10      20      36
20      30      26
30      40      15
40      50      16
50      60      29
60      70      5
70      80      5
80      90      4
90      100     3
100     200     29
200     300     4
300     400     4
400     500     1
500     600     1
600     700     1
700     800     1
800     900     3
900     1000    0
1000    2000    2
2000    3000    1
3000    4000    0
4000    5000    0
5000    6000    1
6000    7000    0
7000    8000    0
8000    9000    0
9000    ...     2

Which, when plotted, gives:
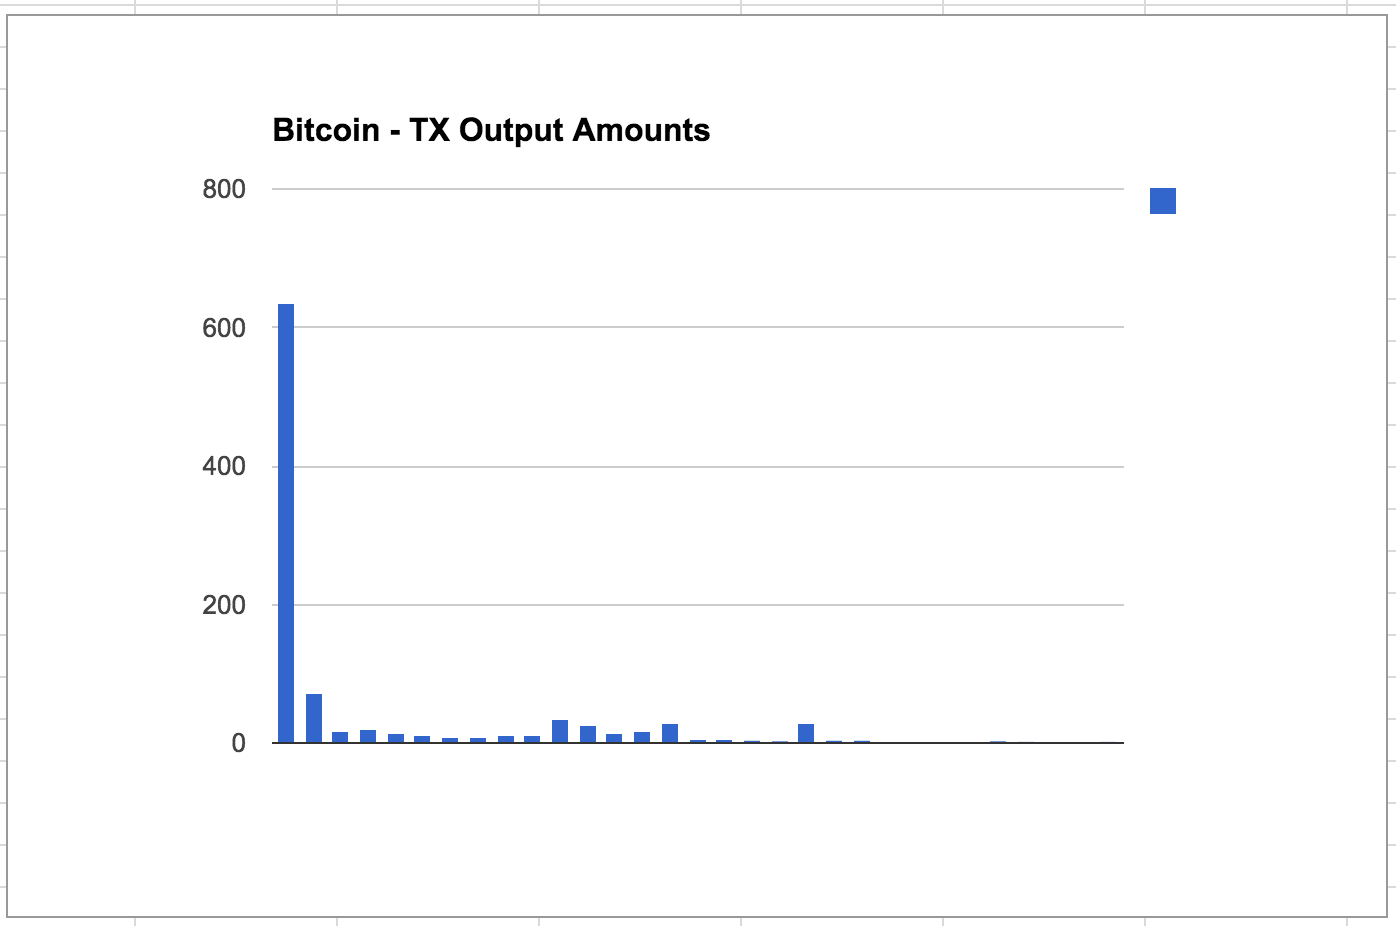
enter image description here

And since the 0-1 outputs make the rest go out of scale, this is a plot without the smallest outputs:
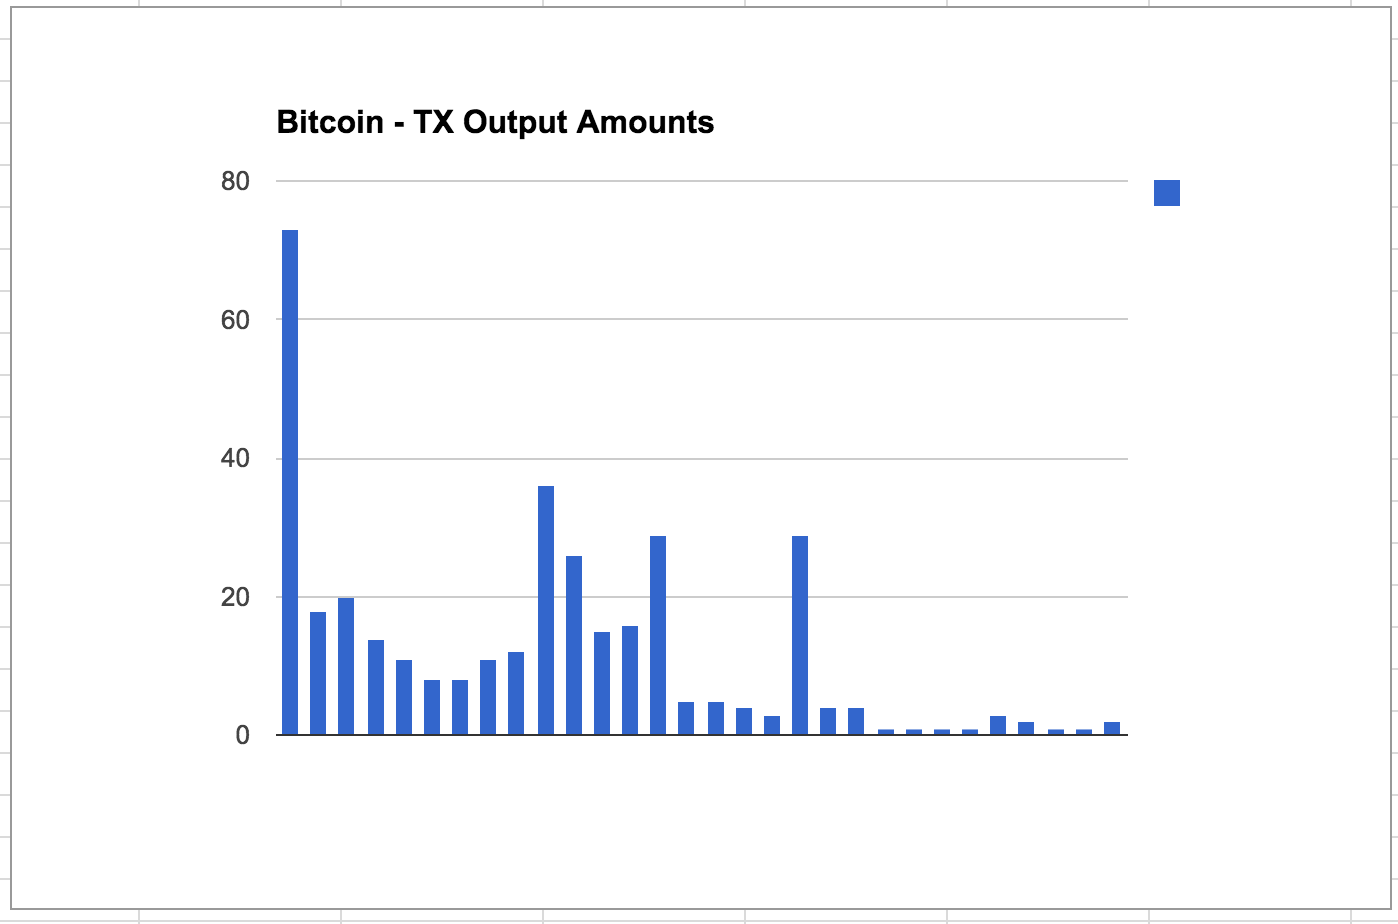
enter image description here

1
  • The Start and End figures, is that satoshis or bitcoins? Thank you for your hard work!
    – Murch
    Commented Nov 5, 2015 at 23:14

Your Answer

By clicking “Post Your Answer”, you agree to our terms of service and acknowledge you have read our privacy policy.

Not the answer you're looking for? Browse other questions tagged or ask your own question.